Density Dependent Regulation in the Populations of Potato-colonizing Aphids
Andrei Alyokhin, Francis A. Drummond, and Gary Sewell
Department of Biological Sciences, University of Maine, 5722 Deering Hall, Orono, ME 04469
This peer-refereed invited review article has been first published by Population Ecology (Volume 47, Pages 257266). The original publication is available at www.springerlink.com. Reproduced with permission of the publisher. Please send me an e-mail if you want a PDF reprint of this article in its original journal format.
ABSTRACT
Scarcity of long-term (over 30 years) data series represents a major challenge for an accurate estimation of the role of density-dependent processes in population regulation. We analyzed population densities of the wingless parthenogenic morphs of buckthorn aphid (BA), Aphis nasturtii Kaltenbach, potato aphid (PA), Macrosiphum euphorbiae (Thomas), and green peach aphid (GPA), Myzus persicae (Sulzer) from 1949 to 2003 for signs of density dependent regulation. We found strong evidence of density-dependent regulation, with detection of density dependence being fairly consistent among the different statistical techniques. Direct density-dependence was detected for the populations of all three species. There was also evidence of delayed density dependence for PA. The periodicity of population fluctuations for BA and GPA was 6.1 and 3.9 years, respectively. The periodicity for PA was not explicit, being highly variable throughout the time series. Effects of density-independent weather factors were relatively minor compared to density-dependent regulation. BA populations experienced a significant reduction in both density and annual oscillations starting in 1995, while GPA populations experienced a similar reduction in 1991. No such change was apparent for PA. The most likely explanation for the observed phenomenon is a change in the composition of the lady beetle community following the establishment of two alien coccinellid species, and/or changes in insecticide use by commercial growers in the area of the study.
Keywords Population regulation · Density dependence · Aphis nasturtii · Macrosiphum euphorbiae · Myzus persicae
Introduction
Because of its large theoretical and applied significance, population regulation is one of the central subjects in the science of ecology (Turchin 1995). An understanding of regulatory mechanisms is important for a better comprehension of the structure of biological communities and evolutionary forces in nature (Pianka 1974; Berryman 1981; Emlen 1984). It is also essential for developing scientifically sound and environmentally friendly pest management strategies (May et al. 1981; Hassell et al. 1989), as well as for the conservation of species and ecosystems (Ginsburg et al. 1990). Not surprisingly, a great amount of theoretical and empirical work has been dedicated to various aspects of population regulation.
The idea of density-dependent regulation, when average growth rate depends to a certain degree on present and/or past population densities, has been a basic concept in many theories that attempted to explain the persistence of animal populations (Royama 1977; Royama 1992; Hanski 1990; Turchin 1995). Despite being intuitively clear, this notion has instigated an extensive and often rather passionate debate that was going on for the past 50 years (e.g., Wolda and Dennis 1993; Hanski et al. 1993; Holyoak and Lawton 1993; Wolda et al. 1994). One of the major reasons for the existing controversy is a paucity of high-quality, long-term population data that can be analyzed for the presence of density dependence (Hassell et al. 1989; Holyoak and Lawton 1992; Woiwod and Hanski 1992; Jarošík and Dixon 1999).
The rate of detecting density dependence is strongly affected by the length of time series (Hassell et al. 1989; Woiwod and Hanski 1992; Holyoak 1993). For example, omitting time series that were shorter than 20 years significantly increased the frequency of density-dependent regulation of moth and aphid populations in the study by Woiwod and Hanski (1992). Ideally, time series should include more than 30 time steps (usually years or generations) (Royama 1992; Ylioja et al. 1999). Unfortunately, relatively few extended time series are available for the analyses. Although several studied time series included 30-67 data steps (Turchin 1990; Whittaker and Tribe 1998; Ylioja et al. 1999), the majority of them were only 9-25 steps long (Wellings et al. 1985; Turchin 1990; Woiwod and Hanski 1992; Maudsley et al. 1996; Sequeira and Dixon 1997; Jarošík and Dixon 1999; Wool 2002). Using shorter time series still allowed making a substantial contribution to the general understanding of population dynamics. However, it might have resulted in underestimating the frequency of density dependence in natural populations. More long-term (over 30 years) data series are needed for an accurate estimation of the role of density-dependent processes in population regulation.
Aphids (Homoptera: Aphidoidea) comprise a large and ubiquitous group of phytophagous insects that have worldwide economic importance. Most aphid species have complex life cycles that vary widely between species, or even between different geographic populations of the same species. This includes alternating sexual and parthenogenic generations, alternating host plant species, and production of wingless or winged morphs in response to direct and/or indirect environmental stimuli (Dixon 1985). Because many aphid species are highly pestiferous, regulation of their populations attracted a considerable amount of scientific attention. Dixon (1985) provided a theoretical argument that aphid populations are likely to be regulated by density-dependent processes. Subsequent analyses of the existing time series generally supported this idea for the majority of tested species (Wellings et al. 1985; Woiwod and Hanski 1992; Turchin and Taylor 1992; Maudsley et al. 1996; Sequeira and Dixon 1997; Jarošík and Dixon 1999), although populations of a few species appeared to be regulated by density-independent mechanisms (Woiwod and Hanski 1992; Holyoak and Lawton 1992; Wool 2002).
Very few time series analyzed in the aforementioned studies were longer than 20 years, and none were longer than 24 years. Also, time series data for as many as 95 species of the total of 101 species tested were obtained by catching winged aphids using suction traps. No distinctions were made between sexual and parthenogenic generations or seasonal and aseasonal migrants. Without any doubt, this methodology provided valuable information. However, it excluded wingless parthenogenic morphs that usually comprise the most numerous and sometimes the most economically important part of the life cycle. Although densities of the winged stages may correlate with the densities of the wingless stages (Howard and Dixon 1990), production of winged individuals may also be affected by a variety of factors, including host plant condition, natural enemies, and temperature (for review, see Müller et al. 2001). Therefore, population densities of winged and wingless aphids may not necessarily trace each other. For example, build-up in natural enemy populations may increase production of winged forms as an induced defense by aphid colonies (Dixon and Agarwala 1999; Weisser et al. 1999), while suppressing wingless populations through predation.
Buckthorn aphid (BA), Aphis nasturtii Kaltenbach, potato aphid (PA), Macrosiphum euphorbiae (Thomas), and green peach aphid (GPA), Myzus persicae (Sulzer) commonly colonize potato plants (Solanum tuberosum L.) in northeastern U.S. and Canada. All three species overwinter as eggs on wild hosts. In the spring, they go through several parthenogenic wingless generations on their winter hosts, and then produce parthenogenic winged spring migrants that colonize secondary summer hosts, including potato. Progeny of the spring migrants is also parthenogenic and usually wingless, although high aphid densities and deteriorating plant quality may lead to production of winged summer migrants. Several overlapping generations are produced during the summer. In the fall, short day photoperiod induces production of sexual fall migrants. Those migrate back to the respective primary winter hosts. On primary hosts, female fall migrants give birth parthenogenically to wingless females, which then mate with the male fall migrants and lay fertilized overwintering eggs (Radcliffe et al. 1993).
In the present study, we analyzed population densities of the wingless parthenogenic morphs of BA, PA, and GPA from 1949 to 2003 for the signs of density dependent regulation.
Materials and Methods
Aphid Population Data:
Data used in this study were collected from the untreated control plots set up as a part of potato insecticide trials at the University of Maine Aroostook Research Farm, Presque Isle, Maine. The trials were conducted every year between 1949 and 2003, except for 1965, 1968, and 1970 (Shands et al. 1950; Shands et al. 1954; Shands and Simpson 1959; Shands et al. 1972a,b,c). Each year, trial results were summarized and distributed among crop protection professionals and potato growers. A copy of each year’s summary was archived as a public domain material at the Maine Agricultural and Forest Experiment Station.
Study protocols were similar each year during the investigations. Experimental plots, 15.24 m long and 4 potato rows wide, were planted to certified seed potato tubers that were cut into 75-80 g pieces prior to planting. The distance between the rows was ~90 cm, and seed spacing was ~35 cm. Approximately 1.8 m was left between the plots within each block, and blocks were spaced at ~3 m. All plots were fertilized with NPK fertilizer at planting and sprayed weekly with fungicides to control fungal diseases of potatoes. Between 5 and 30 plots were planted each year, depending on the number of insecticide treatments tested. Potatoes were grown in a two-year rotation with small grains.
Twenty-five plants were randomly selected at weekly intervals from the middle two rows of each plot. The number of potato-colonizing aphids (BA, PA, and GPA) infesting one top, one middle, and one bottom leaf of each selected plant were counted throughout the growing season from late June until late August or early September (Shands et al. 1954). For operational reasons, the number of plants sampled in each plot was reduced to 20 starting in 1995.
To investigate the long-term population dynamics of the three major potato infesting aphids (BA, PA, GPA) in the Maine potato agro-ecosystem, we calculated the mean number of wingless aphids per leaf per block per sampling date for each year over the 55 year sampling period. Missing data for the three years 1965, 1968, and 1970 were estimated by fixed-point smoothing, a method of interpolation commonly used for time series data (Harvey and Pierse 1984; Kohn and Ansley 1986; SPSS 2002).
Weather data:
Daily weather data for the years 1949 through 2003 was collected “on-site” at the Aroostook Research Farm as described by Baron et al. (1980). Selected weather data summaries were used to determine the variation in aphid population fluctuations due to temperature and precipitation. The following weather data summaries were used for our investigation: mean daily winter (December, January, and February) temperature; mean daily summer (June, July, and August) temperature; mean daily temperature for the months of December, January, February, June, July, and August; mean daily winter precipitation; mean daily summer precipitation; and mean daily precipitation for the months of December, January, February, June, July, and August.
Data Analysis:
The focus of our analysis was to assess the likelihood that populations of the three major potato infesting aphid species in Presque Isle, ME are regulated or influenced by density dependent mechanisms. Unless specified otherwise, all aphid densities used in our analyses were logarithm transformed (base 10). Statistically significant relationship between aphid density (log (N(t))) or population rate of increase (log (N(t) / N(t-1))) in a given year and aphid density in preceding years (log (N(t-i)) was considered to be an indication of density dependent regulation. More specifically, we relied upon a variety of descriptive statistics, graphical approaches, and modeling techniques to assess the existence of density dependence.
The standard deviation of the log transformed aphid densities, S, was used as a measure of amplitude, peak to trough ratio (Stenseth and Framstad 1980). Interpretation of the statistic S as it relates to population dynamics is reviewed by Turchin (2003) who shows that S is linearly related to the peak/trough density ratio. Thus, an S estimate of 0.35 suggests an order of magnitude between peak and trough density. The skew of the distributions of the aphid densities and population rates of increase were calculated and tested to see if the skew was significantly different from zero. That described the shape, form, and symmetry of the population fluctuations (Royama 1992; Turchin 2003; Resampling Stats 1995). Riker phase plots of population rates of increase vs. aphid densities in the immediately preceding years (log (N(t-1))) were constructed as a visual means of assessing density dependence (Turchin 2003). Spectral analysis was used to estimate periodicity in the long-term population trends (Wei 1990; SAS Institutes 2002). The distribution-free methodology of Pollard et al. (1987) was used to test for density-dependence using the software Resampling Stats (1995) with 5000 bootstrap randomizations. Indications of delayed density dependence were based upon the partial autocorrelation function of the untransformed and log transformed aphid densities (Royama 1992) and a modified bootstrap test described by Holyoak (1994).
Linear time series autoregressive moving-average (ARMA) models were fit to both the untransformed and logarithm transformed aphid densities (SAS Institutes 2002). The log form of the model used is:
log (N(t) ) = a0 + b1 log (N(t-1)) +…+ bi log (N (t-i) ) + Z(t) + c1 Z(t-1) +…+ ci Z(t-i) (1)
Where:a0 is the intercept, b’s are the density dependent autoregressive coefficients, c’s are the moving average stochastic (error) coefficients, and Z(t)’s are the moving average model parameters.
The choice of selecting a transformation for the aphid density data was mainly based upon whether the time series was stationary (Wei 1990). In addition, autocorrelation function plots, partial autocorrelation function plots, adjusted R2, and Akaike’s Information Criterion and Schwarz’s Bayesian Criterion were used to select candidate models. We constructed 95% confidence intervals about the autoregressive coefficients to test for density dependence. Evidence of density dependence was assumed if the value 1.0 fell within the confidence intervals, distinguishing the time series from a random walk process (Royama 1992, p. 9).
Non-linear time series modeling as described by Turchin (2003) is a response surface polynomial regression based upon Box-Cox transformation of the independent variables. However, for all of our models the Box-Cox transformations were always estimated to be close to 0 or the logarithmic transformation. The log form of the fitted model, as described by Turchin (2003), is:
log (N(t) / N(t-1)) = a0 + a1 log(N(t-1)) + a2 log(N(t-2)) + a1.1 (log(N(t-1)) )2 + a2.2 (log(N(t-2)))2 + a1.2 (log(N(t-1)) log (N(t-2)) ) + ε(t) (2)
Where:a0 is the intercept, a’s are coefficients of density dependence and ε(t) is the stochastic exogenous influence.
The response surface modeling platform in JMP software (SAS Institutes 2002) was used to estimate model parameters. We adopted a conceptual approach similar to that of Morris (1963) to model the long-term population trends by first modeling the density independent effects of weather on the aphid population rates of increase and then regressing aphid density counts on the residuals from the initial model which used weather data as independent variables. This allowed us to remove the density independent weather effects from the population trends for subsequent investigation of density dependence. All R2 reported are adjusted by the number of independent predictor variables.
Results
Figure 1 depicts the long-term population fluctuations of BA (Fig. 1A), PA (Fig. 1B), and GPA (Fig. 1C). A similar trend can be seen for BA and GPA, a reduction in large population fluctuations and mean density over time (S = 0.749 and S = 0.537, respectively, ca. two orders of magnitude between peak and trough densities), whereas, PA tends to fluctuate at a moderate amplitude throughout the 55 years (S = 0.368, ca. one order of magnitude between peak and trough densities).
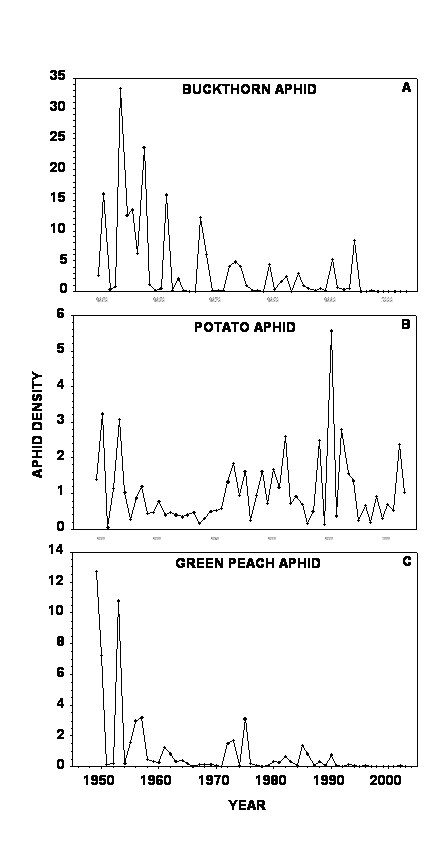
Figure 1. Mean annual aphid densities (wingless aphids per leaf) on untreated potato plots between 1949 and 2003. (A) – buckthorn aphid, (B) – potato aphid, and (C) – green peach aphid.
The population rates of increase for all three species appear to be symmetric (Fig. 2) with the skewness for population rates of increase being 0.358, -0.203, and 0.203, respectively. None of these coefficients differ significantly from zero (P>0.05 based upon 1000 bootstrap randomizations). This suggests that extreme population crashes compared to more gradual population decreases do not characterize these three population trends. This is also supported by the skewness of population densities for BA, PA, and GPA being –0.115, -0.156, and 0.314, respectively. None of these coefficients differ significantly from zero (P>0.05 based upon 1000 bootstrap randomizations), suggesting a series of sharp and ephemeral peaks. The periodicity of population fluctuations for BA and GPA is 6.1 and 3.9 yrs as suggested by the spectral density (Wei 1990). The periodicity for PA is not explicit, being highly variable throughout the time series.
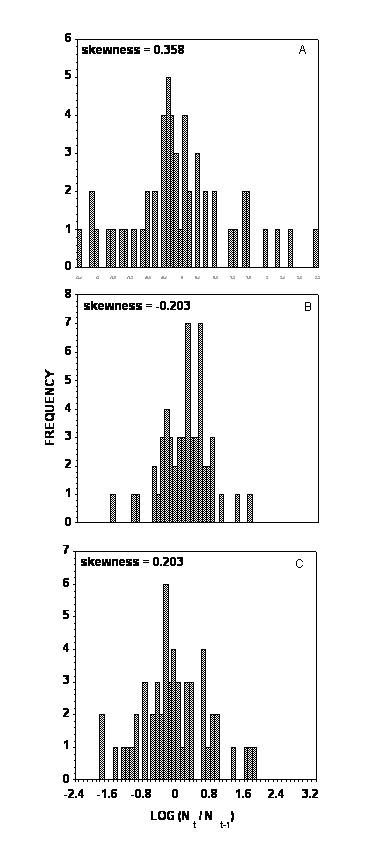
Figure 2. Frequency distributions of rates of annual population increase on untreated potato plots between 1949 and 2003. (A) – buckthorn aphid, (B) – potato aphid, and (C) – green peach aphid.
The Riker phase plots (Fig. 3) show that density dependence can be expected for all three aphid species, but most strongly for the case of PA (Fig. 3B).
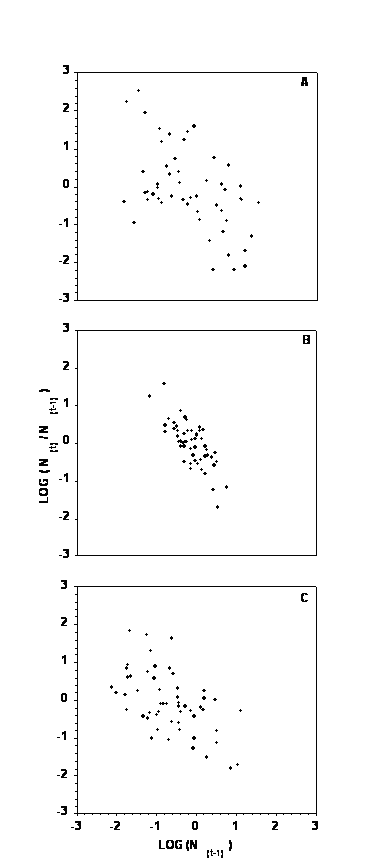
Figure 3. The Riker phase plots showing relationship between population density and the rate of annual population increase expressed on the logarithmic scale. (A) – buckthorn aphid, (B) – potato aphid, and (C) – green peach aphid. Inverse relationship indicates simple density dependence.
Closer inspection of the relationship between population rate of increase and population density in the immediately preceding year (Fig. 4) shows some evidence of both simple density dependence (back and forth fluctuations about the mean of population increase) and delayed density dependence (circular clockwise orbits about a mean, Royama 1992; Turchin 2003). Bootstrap tests for density dependence (Pollard et al. 1987) suggest that BA, PA, and GPA are regulated by simple density dependence (P=0.9999, P=0.84, and P=0.97, respectively, where P is the probability that simple density dependence regulates the population). Bootstrap tests for delayed density dependence (Holyoak 1994) do not support the case for delayed density dependence in BA or GPA (P=0.036, P=0.012). It is not as clear for PA, where delayed density dependence may occur at a probability of P=0.097.
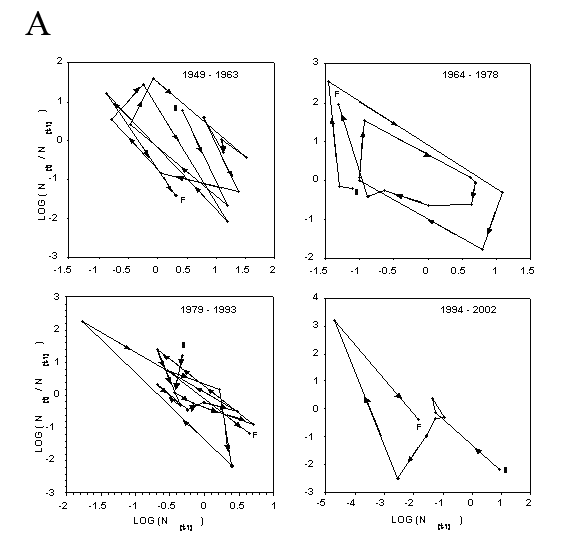
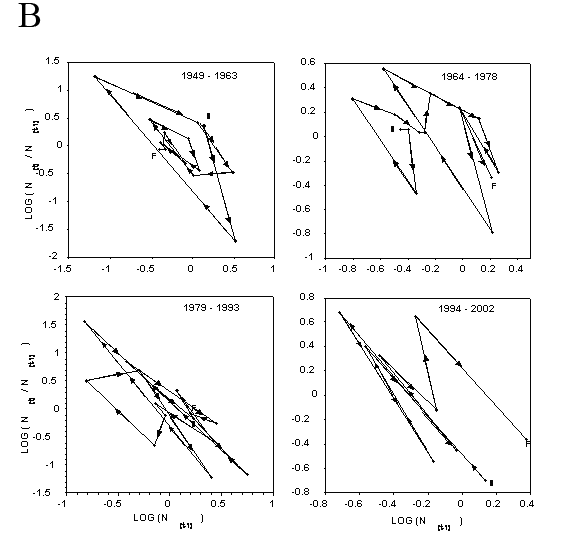

Figure 4. Dynamics of the rate of annual population increase for wingless aphids on untreated potato plots between 1949 and 2003. (A) – buckthorn aphid, (B) – potato aphid, and (C) – green peach aphid. Fifty-five consecutive year period is broken down into three 15-year segments and a final ten-year segment for ease of inspection. S indicates starting and F indicates finishing points of each phase plot. Arrowheads show the direction (chronologically) of the clockwise cycles in the phase plots. Back and forth fluctuations about the mean of population rate of increase indicate simple density dependence. Circular clockwise orbits about a mean indicate delayed density independence.
Linear time series analysis (ARMA) on the logarithm transformed aphid densities (untransformed densities for PA) suggests that a weak case for simple density dependence can be made for all three species, and possibly a delayed density dependent response for PA (Table 1). Models were selected by choosing the model associated with the smallest Akaike's Information Criterion (AIC) and Schwarz's Bayesian Criterion (SBC) providing that the parameter estimates were stable. These values were–35.26 and –29.24 for the AIC and SBC, respectively for the log buckthorn aphid model (14 and 15% smaller than the next best fitting model); -9.07 and 0.968 for the AIC and SBC, respectively for the untransformed potato aphid model (23 and 51% smaller than the next best fitting model); and –78.24 and –72.26 for the AIC and SBC, respectively for the log green peach aphid model (6 and 3% smaller than next best fitting model). The partial correlation function for PA suggests a significant correlation for lag at time = 2 (after the correlation for lag at time = 1 has been factored out) of r=0.309 also indicating a possible delayed density dependence (Royama 1992). The 95% confidence intervals for the first-order autoregressive terms indicated that 1.0 falls within the interval for BA, and come very close for PA and GPA (upper limit for confidence interval is 1.216 for BA, 0.954 for PA, and 0.965 for GPA). Autocorrelation functions were also significant at time lags of t-1, t-2, and t-1 for BA, PA, and GPA, respectively (Table 1). Although autocorrelation functions do not provide a proof of density dependence by themselves, they reinforce the evidence of weak density dependence provided by the confidence intervals in all three linear time series models. In the same time, the linear ARMA models do not explain a high degree of the variation in population fluctuation. This lack of strong evidence is not surprising since ARMA models have been shown to lack power in the ability to identify density dependence (Turchin 2003).
Table 1. Linear ARMA time series models* for buckthorn aphid, potato aphid, and green peach aphid.
Species |
Coefficient |
Time Lag |
Estimate |
SE |
Adjusted R2 |
|
BA
|
AR†, b1 MA∆, c1 |
0 1 1 |
-0.0783 0.7176 |
0.2700 0.1437 0.2196 |
0.7730 <0.0001 0.0019 |
0.1041 |
PA**
|
AR, b1 AR, b2 MA, c1 MA, c2 |
0 1 2 1 2 |
1.072 0.6155 -0.3220 0.8060 -0.8873 |
0.1716 0.1613 0.1790 0.0806 0.1132 |
<0.0001 <0.0001 0.0781 <0.0001 <0.0001 |
0.1675 |
GPA |
AR, b1 MA, c1 |
0 1 1 |
-0.3189 0.9613 0.7412 |
0.3123 0.0016 0.0012 |
0.3122 <0.0001 <0.0001 |
0.1506 |
* model: log (N(t) ) = a0 + b1 log (N(t-1)) +…+ bi log (N (t-i) ) + Z(t) + c1 Z(t-1) +…+ ci Z(t-i)
** model for untransformed population densities
∆ARs are the autoregressive or density dependent terms (coefficients bi) in the linear time series model above (see equation 1 in methods section for more detail)
† MAs are the moving average or stochastic terms (coefficients ci) in the linear time series model above (see equation 1 in methods section for more detail)
The non-linear time series models also support a hypothesis that density dependence is involved in regulating populations of the three major potato infesting aphid species in Maine. Weather does affect population fluctuations, but to a minor extent relative to possible density dependent mechanisms (Table 2). The only weather measures that were associated with aphid population change was precipitation level. BA rate of population increase was found to be associated with winter precipitation (log transformed, R2 = 0.078, P=0.023). However, August precipitation was associated with the dynamics of the rates of population increase in both GPA and PA (untransformed, R2 = 0.099, P=0.012; log transformed, R2 = 0.071, P=0.045; respectively). There were no seasonal temperature measures that were significantly related to the rates of population increase for all three species. After removing the effects of weather (modeling rate residuals) we found evidence to support simple density dependent effects (Table 2).
Table 2. Non-linear time series model coefficients for residuals of rates of annual population increase after removal of significant weather effects (see text for details).
Species |
Coefficient* |
Estimate |
SE |
Adjusted R2 |
|
BA |
-0.059 |
0.152 |
0.669 |
0.148 |
|
|
a1 |
-0.703 |
0.205 |
0.001 |
|
|
a2 |
0.11 |
0.208 |
0.598 |
|
PA |
-0.778 |
0.055 |
0.167 |
0.582 |
|
|
a1 |
-1.202 |
0.16 |
<0.0001 |
|
|
a2 |
0.221 |
0.163 |
0.181 |
|
GPA |
-0.18 |
0.136 |
0.189 |
0.246 |
|
|
a1 |
-0.746 |
0.199 |
0.0005 |
|
|
a2 |
0.181 |
0.197 |
0.331 |
|
Figure 5 shows the observed residuals and residuals predicted by the non-linear time series models (Equation 2) that assumed simple density dependence. BA density explained 14.8 % of the variation in the residuals (Fig. 5A). PA density explained 58.2% of the change in residuals (Fig. 5B), and GPA density explained 24.6% of variation in residuals (Fig. 5C).
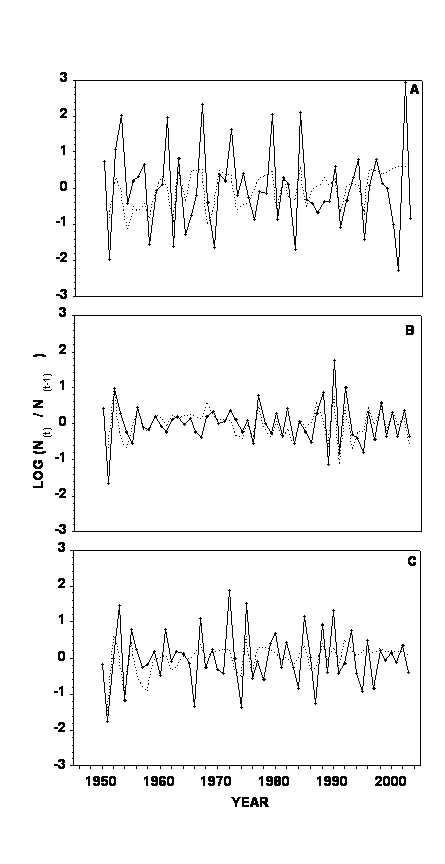
Figure 5. Residuals of the rate of annual population increase over time after accounting for density independent weather effects. Solid line connects annual data points calculated from actual data. Dashed line connects annual data points predicted by non-linear time series model (see Equation 2 in the text). (A) – buckthorn aphid, (B) – potato aphid, and (C) – green peach aphid.
The aphid community on potato, comprised almost exclusively of these three species, tends to have synchronized population oscillations. However, this synchrony is moderate to weak, as suggested by lagged cross correlation analysis (Wilkinson 1989) between the three species (BA vs GPA: r=+0.627 at time lag=0, r=+0.391 at time lag =-1; BA vs PA: r=+0.281 at time lag=0; and GPA vs PA: r=+0.353 at time lag=0). Total aphid (all three species) density was also significantly associated with species specific changes in population density. This suggests that the density dependent mechanisms that are affecting one aphid population might be general in nature and affect all of the three aphid species populations simultaneously. Again, after weather effects had been removed, modeling the residual rates of population increase by total aphid population density (all three species densities combined), simple density dependent relationships were found for BA (R2 = 0.141, P=0.0132 for log (N(t-1))), PA (R2 = 0.317, P<0.0001 for log (N(t-1))), and GPA (R2 = 0.093, P=0.053 for log (N(t-1))).
Discussion
Our data provide strong evidence of density-dependent regulation, with detection of density dependence being fairly consistent among the different statistical techniques that we used. Effects of density-independent weather factors were relatively minor compared to the density-dependent regulation. This is similar to the earlier findings by Jarošík and Dixon (1999) who studied population dynamics of the Turkey-oak aphid (Myzocallis boerneri Stroyan). At the same time, Maudsley et al. (1996) found more pronounced weather effects for several species of cereal aphids, although they also reported a significant density-dependent regulation.
Despite being obtained for wingless aphids, our results are very similar to the results collected for winged aphids (Woiwod and Hanski 1992; Maudsley et al. 1996). This may indicate that density-dependent factors directly affect densities of both morphotypes (e.g., natural enemies attack both winged and wingless individuals in a density-dependent manner). Alternatively, fluctuations in populations of winged individuals might be driven by the density-dependent fluctuations in populations of their wingless parents (e.g., natural enemies attack wingless individuals in a density-dependent manner, alleviating overcrowding and resulting in reduced production of winged forms). Also, both mechanisms may work simultaneously and interact with each other. Of course, it is important to keep in mind that because the data for winged and wingless aphids were collected in different geographic areas, comparison between morphotypes that we make is highly speculative.
Natural enemy response to the density of their prey or hosts is often responsible for density-dependent processes in animal populations (Royama 1992). Potato-colonizing aphids in Northern Maine have a diverse and abundant natural enemy complex that is comprised of five species of lady beetles (Shands et al. 1972a; Alyokhin and Sewell 2004), at least seven species of entomopathogenic fungi (Shands et al. 1963; Shands et al. 1972b), and at least 15 species of parasitoid wasps (Shands et al. 1972c). Of those, lady beetles (Shands et al. 1972a) and entomopathogenic fungi (Shands et al. 1963, Shands et al. 1972b) have been shown to have a significant effect on aphid populations. Therefore, we believe it is reasonable to suggest that the natural enemies, at least in part, can be implicated in the observed density dependence in the annual aphid dynamics. Unfortunately, this natural enemy complex was not sampled in its entirety during the 55-year study presented here.
Another driving force behind density-dependent regulation of animal populations is direct or indirect mutual interference between population members (including competition for resources) (Royama 1992). In some years, peak populations of BA, PA, and GPA observed in our study were sufficient for having a significant negative effect on potato plants (Shands et al. 1972d). Poor host quality might have resulted in population suppression through increased mortality, reduced reproduction, and emigration in search of a better habitat. Furthermore, with aphids, overcrowding commonly induces mass production of winged progeny even under otherwise optimal conditions (Müller et al. 2001). Subsequent emigration of winged aphids from experimental plots might have also contributed to the reduction of resident aphid populations during subsequent years of the study.
Being fairly general in their effects, the discussed factors were likely to affect all three aphid species in a similar way. Indeed, there was a noticeable degree of synchrony in the oscillation of BA, PA, and GPA densities. However, the observed synchrony was far from complete, and population of each species was still characterized by its own dynamics. Populations of BA and GPA appeared to exhibit cyclical behavior, with amplitudes of 6.1 and 3.9 years, respectively. No such periodicity was detected for PA populations. Also, there was evidence of delayed density dependence for the PA, but not for BA and GPA. The differences can probably be attributed to the peculiarities of each species’ biology, but more research is required before we can provide a more specific explanation.
Interestingly, BA populations experienced a significant reduction in both density and its annual oscillations starting in 1995, while GPA populations experienced a similar reduction beginning in 1991. Periods of comparable low density were observed during earlier years of the study, but none of them lasted as long as the last decline (Fig. 1). No such change was apparent for PA. The observed reduction might have been caused by a recent dramatic alteration in the lady beetle community in northern Maine following the introduction of two alien species (Alyokhin and Sewell 2004), and/or better aphid control by new generation insecticides used by most commercial growers in the area since mid-1990s (Sewell, unpublished), resulting in a regional large-scale decline of aphid populations. However, exact causes of the observed decline still remain to be determined.
Overall, our data support Dixon’s (1985) argument that aphid populations are likely to be regulated by density-dependent mechanisms. Our findings are similar to that of other authors, and seem to be consistent with what is known about basic biology and ecology of potato-colonizing aphid species. Further investigations of the driving forces behind observed density dependence may also improve our ability to manipulate and control aphid densities in commercial potato production.
Acknowledgments
This work would not be possible without detailed annual insecticide efficiency reports prepared and archived by W. Shands, G. Simpson, and R. Storch. We also thank R. Jardine for technical assistance during the last 40 field seasons, and C. Theriault for help with entering and summarizing the data. This is Publication No. 2821 of the Maine Agricultural and Forest Experiment Station.
References
Alyokhin A, Sewell G (2004) Changes in a lady beetle community following the establishment of three alien species. Biological Invasions 6:463-471
Baron WR, Smith DC, Borns Jr HW, Fastook J, Bridges AE (1980) Long-time series temperature and precipitation records for Maine, 1808-1978. Life Sci Agric Experiment Station Bull 771, University of Maine, Orono, Maine
Berryman AA (1981) Population Systems. Plenum Press, New York
Dixon AFG (1985) Aphid Ecology. Blackie, Glasgow
Dixon AFG, Agarwala BK (1999) Ladybird-induced life-history changes in aphids. Proc Royal Soc London B 266:1549-1553
Emlen JM (1984) Population Biology. Macmillan, New York
Ginsburg LRS, Ferson S, Akcakaya HR (1990) Reconstructibility of density dependence and the conservative assessment of extinction risks. Conservation Biol 4:63-70
Hanski I (1990) Density dependence, regulation and variability in animal populations. Phil Trans Royal Soc London B 330:141-150
Hanski I, Woiwod I, Perry J (1993) Density dependence, population persistence, and largely futile arguments. Oecologia 95:595-598
Harvey AC, Pierse RG (1984) Estimating missing observations in economic time series.J Am Stat Assoc 79:125-131
Hassell MP, Latto J, May RM (1989) Seeing the wood for the trees: detecting density dependence from existing life table studies. J Animal Ecol 58:883-892
Holyoak M (1994) Identifying delayed density dependence in time series data. Oikos 70:296-304
Holyoak M, Lawton JH (1992) Detection of density dependence from annual censuses of bracken-feeding insects. Oecologia 91:425-430
Holyoak M, Lawton JH (1993) Comments arising from a paper by Wolda and Dennis: using and interpreting the results of tests for density dependence. Oecologia 95:592-594
Holyoak M (1993) New insights into testing for density dependence. Oecologia: 93:435-444
Howard MT, Dixon AFG (1990) Forecasting of peak population density of the rose grain aphid Metopolophium dirhodum on wheat. Ann Appl Biol 117:9-19
Jarošík V, Dixon AFG (1999) Population dynamics of a tree-dwelling aphid: regulation and density-independent processes. J Animal Ecol 68:726-732
Kohn R, Ansley CF (1986) Estimation, predicition, and interpolation for ARMA models with missing data. J Am Stat Assoc 81:751-761
Maudsley MJ, MacKenzie A, Thacker,J.I., Dixon AFG. (1996) Density dependence in cereal aphid populations. Ann Appl Biol 128:453-463
May RM, Hassell MP, Anderson RM, Tonkin DW (1981) Density dependence in host-parasitoid models. J Anim Ecol 50:855-865
Müller CB, Williams IS, Hardie J (2001) The role of nutrition, crowding and interspecific interactions in the development of winged aphids. Ecol Entomol 26:330-340
Morris RF (1963) Predictive population equations based upon key factors. Memoirs Entomol Soc Canada 32:16-21
Pollard E, Lakhani KH, Rothery P (1987) The detection of density-dependence from a series of annual censuses. Ecology 68:2046-2055
Pianka ER (1974) Evolutionary Ecology. Harper and Row, New York
Resampling Stats, Inc (1995) Resampling Stats. Arlington, VA
Radcliffe EB, Flanders KL, Ragsdale DW (1993) Management of aphids and leafhoppers. In: Rowe RC (ed) Potato Health Management. APS Press, St. Paul, Minnesota, pp 103-115
Royama T (1977) Population persistence and density dependence. Ecol Monographs 47:1-35
Royama T (1992) Analytical population dynamics. Chapman and Hall, London
SAS Institute, Inc (2002) JMP: The Statistical Discovery Software, version 5. SAS Institute, Cary, NC
Sequeira R, Dixon AFG (1997) Population dynamics of tree-dwelling aphids: the importance of seasonality and time scale. Ecology 78:2603-2610
Shands WA, Simpson GW, Lombard PM, Cobb RM, Lung PH (1950) Control of aphids on potatoes with DDT when used with fungicides. The Maine Agric Experiment Station Bull 480, University of Maine, Orono, Maine
Shands WA, Simpson GW (1959) Characteristics of aphid-population growth on potatoes in northeastern Maine. Ann Entomol Soc Am 52:117-121
Shands WA, Simpson GW, Reed LB (1954) Subunits for estimating aphid abundance on potatoes. J Econ Entomol 47:1024-1027
Shands WA, Simpson GW, Hall IM (1963) Importance of entomogenous fungi in controlling aphids on potatoes in Northeastern Maine. The Maine Agric Experiment Station Tech Series Bull T6, University of Maine, Orono, Maine
Shands WA, Simpson GW, Wave HE, Gordon CC (1972a) Importance of arthropod predators in controlling aphids on potatoes in Northeastern Maine. 54, University of Maine, Orono, Maine
Shands WA, Simpson GW, Hall IM, Gordon CC (1972b) Further evaluation of entomogenous fungi as a biological control agent of aphid control in Northeastern Maine. Life Sci Agric Experiment Station Tech Bull 58, University of Maine, Orono, Maine
Shands WA, Simpson GW, Gordon CC (1972c) Survey of internal parasites of potato-infesting aphids in Northeastern Maine, 1963 through 1969. Life Sci Agric Experiment Station Tech Bull 60, University of Maine, Orono, Maine
Shands WA, Simpson GW, Seaman BA, Roberts FS, Flynn CM (1972d) Effects of differing abundance levels of aphids and of certain virus diseases upon yield and virus disease spread in potatoes. Life Sci Agric Experiment Station Tech Bull 56, University of Maine, Orono, Maine
SPSS Inc (2002) Missing Value Analysis. Chicago, Illinois
Stenseth NC, Framstad E (1980) Reproductive effort and optimal reproductive rates in small rodents. Oikos 34:23-34
Turchin P (1990) Rarity of density dependence or population regulation with lags? Nature 344:660-663
Turchin P, Taylor AD (1992) Complex dynamics in ecological time series. Ecology: 73:289-305
Turchin P (1995) Population regulation: Old arguments and a new synthesis. In: Cappuccino N, Price P (eds) Population dynamics: new approaches and synthesis. Academic Press, San Diego, pp. 17-40
Turchin P (2003) Complex Population Dynamics: A Theoretical/Empirical Synthesis. Princeton University Press, Princeton, New Jersey
Wei WWS (1990) Time Series Analysis, Univariate and Multivariate Methods. Addison-Wesley Publishing Company, Redwood City, California
Weisser WW, Braendle C, Minoretti N (1999) Predator induced morphological shift in the pea aphid. Proc Royal Soc London B, 266:1175-1181
Wellings PW, Chambers RJ, Dixon AFG, Aikman DP (1985) Sycamore aphid numbers and population density. I. Some patterns. J Animal Ecol 54:411-424
Whittaker JB, Tribe NP (1998) Predicting numbers of an insect (Neophilaenus lineatus: Homoptera) in a changing climate. J Animal Ecol 67:987-991
Wilkinson L (1989) SYSTAT: The System for Statistics. Systat, Inc., Evanston, Illinois.
Woiwod IP, Hanski I. (1992) Patterns of density dependence in moths and aphids. J Animal Ecol 61:619-629
Wolda H, Dennis B. (1993) Density dependence tests, are they? Oecologia 95:581-591
Wolda H, Dennis B, Taper ML (1994) Density dependence tests, and largely futile comments: Answers to Holyoak and Lawton (1993) and Hanski, Woiwod and Perry (1993). Oecologia 98:229-234
Wool D (2002) Herbivore abundance is independent of weather? A 20-year study of a galling aphid Baizongia pistacia (Homoptera: Aphidoidea). Popul Ecol 44:281-291
Ylioja T, Roininen H, Ayres MP, Rousi M, Price PW (1999) Host-driven population dynamics in an herbivorous insect. PNAS USA 96:10735-10740